

In a world where financial rhetoric spirals into storytelling and market conjunctures, risk remains one of the few entities that eludes the comfort of narrative: it must be measured, represented, understood. But if risk is by definition an unknown, what is the most rigorous — and at the same time operational — way to attempt to capture its trajectory and quantify its impact?
Two tools, often invoked with quasi-sacred reverence yet rarely grasped in their methodological essence, have long vied for the starring role in risk analysis: the volatility cone and Value at Risk (VaR). Both are derived from the same raw material — the current portfolio structure and its historical series — but diverge deeply in assumptions, form, and function.
The Volatility Cone as a probabilistic representation of the future
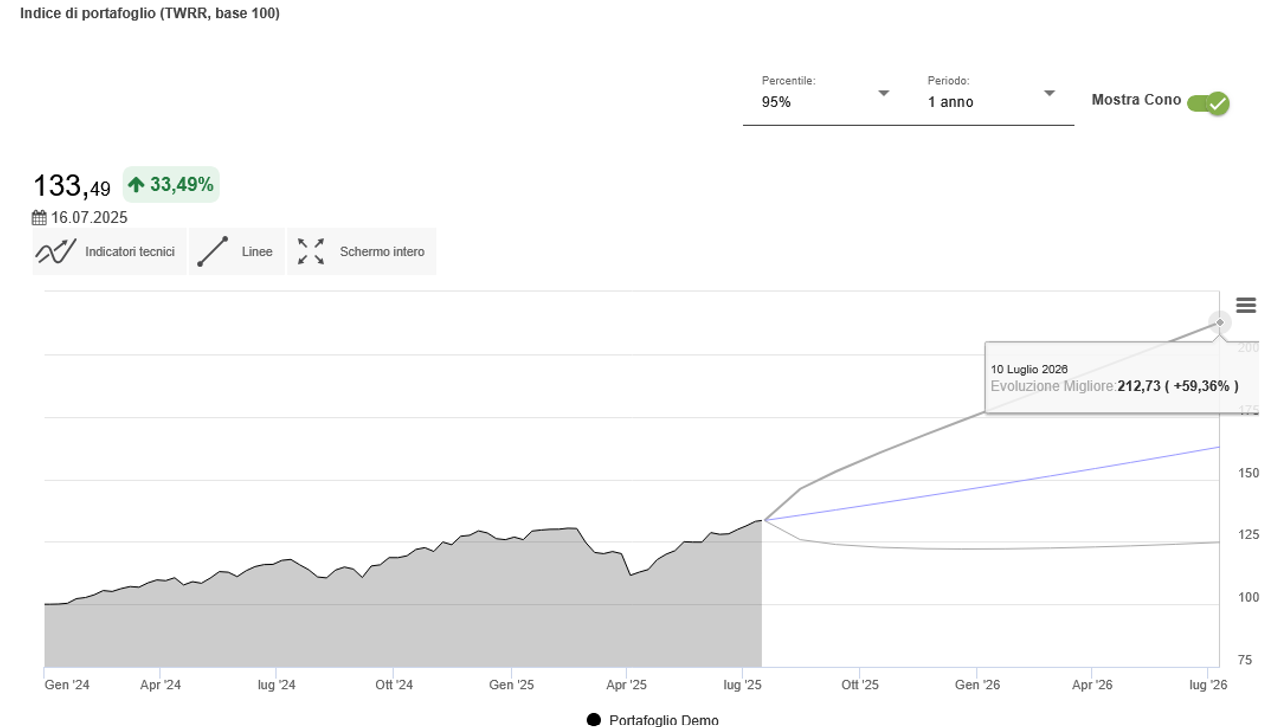
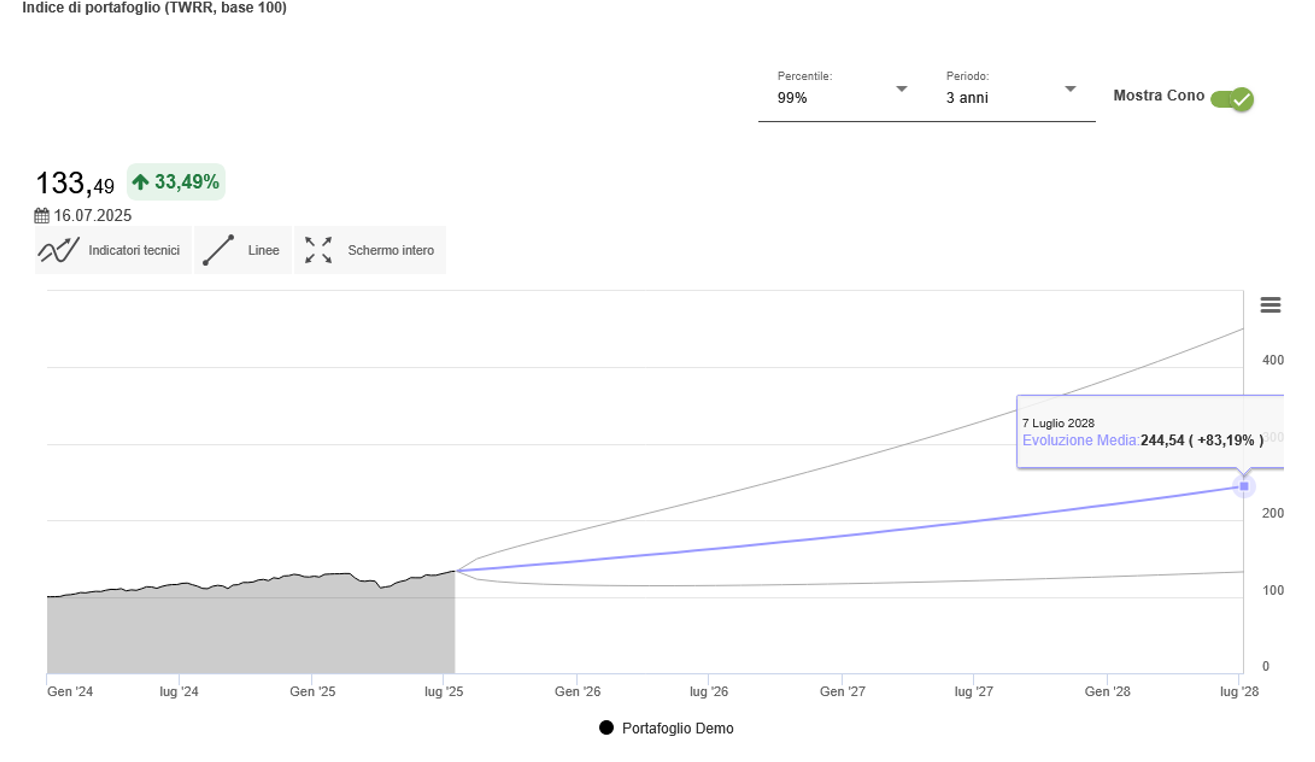
The volatility cone rests on an assumption as rigorous as it is elegant: if one accepts the hypothesis of normally distributed log-returns, it is possible to construct a statistical interval within which the portfolio value may vary forward in time with a certain probability. This probability is encoded in the usual confidence levels (95%, 97.5%, 99%) that define its geometric boundaries.
The result is a visual figure that widens over time, offering a stochastic projection of uncertainty. It must be stressed: this is not a point forecast, but a map of possible trajectories the portfolio could follow.
Source: FIDAworkstation
The underlying methodology requires precise calibration of three key elements:
-
Starting date: the temporal anchor point from which the projection unfolds
-
Historical depth: the breadth of the sample used to estimate volatility
-
Confidence level: the probability within which possible variations are to be contained
 Source: FIDAworkstation
In cases where historical data are insufficient or unrepresentative, the methodology calls for the use of carefully selected proxies — a far-from-negligible element to ensure the soundness of estimates and the robustness of the analysis.
Value at Risk: measuring expected damage
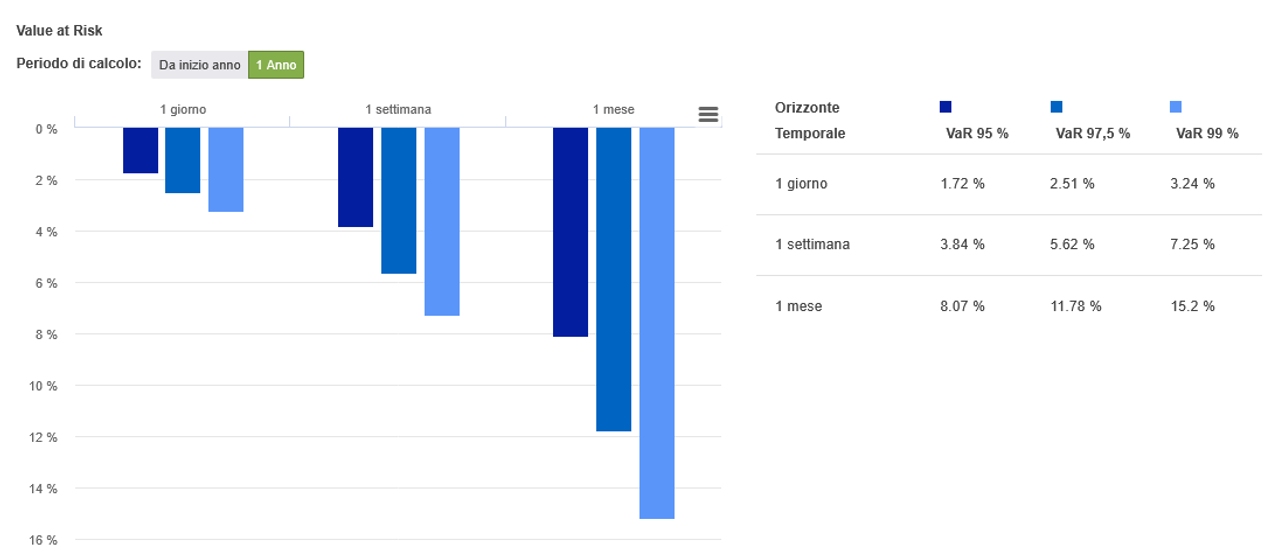
Value at Risk, in its sober analytical power, approaches risk from a different conceptual angle. It is not concerned with where the portfolio might go, but rather how much it might lose, with a certain probability, over a defined time horizon.
VaR thus provides a measure of the maximum expected loss under normal market conditions — an estimate of damage, not drift. The most robust and operational method of calculation is that of historical simulation: a technique that dispenses with theoretical distributional assumptions, relying instead on the empirical distribution of observed returns.
Source: FIDAworkstation
The time horizon is discrete — typically a day, a week, a month — and the output is a crisp, unambiguous number: VaR is, by its very nature, dry, pragmatic, incisive. It is the preferred tool of real-time risk managers, of those who must answer to committees, regulators, and clients in a language that admits no room for interpretive nuance.
Historical simulation ranks the portfolio’s past returns from worst to best, identifying the percentile corresponding to the chosen confidence level. A 95% VaR means stating that, under normal conditions, 95% of the time losses will not exceed that threshold.
Two complementary views of the same phenomenon
Though they share the same inputs — portfolio composition, historical returns, confidence levels — the cone and VaR diverge substantially in their logical assumptions and operational goals.
- Time Dimension
The cone describes a continuous trajectory, while VaR defines a discrete threshold. The former projects an evolving uncertainty band, the latter bounds potential risk within a fixed timeframe. - Representation
The cone is visual, offering an intuitive graphical representation of uncertainty; VaR is numerical, providing a precise quantification of risk. - Operational Function
The cone answers the question: “How far can we go?”
VaR answers the question: “How much can we lose?”
Synergistic integration and complementarity
It is precisely this methodological divergence that underpins their strategic complementarity. Those engaged in advanced advisory and risk management stand to benefit greatly from the combined use of both tools: on the one hand, the map of probabilities evolving over time; on the other, the limit beyond which losses become intolerable.
A platform that integrates these tools synergistically enables:
-
Visualization of multiple scenarios: comparing different portfolio configurations using the volatility cone
-
Quantification of risk thresholds: defining precise operational limits via VaR
-
Real-time parameter calibration: adjusting the analysis to current market conditions
-
Effective communication: translating mathematical complexity into understandable representations
Practical applications in contemporary asset management
- In Wealth Advisory
The advisor can use the volatility cone to educate clients about possible portfolio evolutions, visually demonstrating how uncertainty expands over time. In parallel, VaR provides concrete thresholds for defining stop-loss or rebalancing strategies. - In Institutional Risk Management
Asset managers can use VaR to monitor daily risk exposure and comply with regulatory limits, while the volatility cone supports long-term strategic decisions. - In Client Reporting
The integration of both tools allows for building complete risk narratives: the cone to contextualize historical performance, and VaR to set realistic expectations on potential drawdowns.
Source: FIDAworkstation
Technology as an Enabler of Advanced Risk Analysis
In an environment of tightening regulation and increasingly informed (or at least demanding) clients, having tools that allow for granular, visually comprehensible risk analysis becomes a necessity, not a luxury.
The ability to adjust parameters in real-time, compare alternative scenarios, integrate heterogeneous data, and visually represent uncertainty is now a key factor in transparent risk communication. Not only from a compliance standpoint, but even more so as a form of concrete, tangible, measurable financial education.
Toward a conscious risk culture
True innovation does not lie in the individual tools themselves, but in their intelligent orchestration within workflows that turn mathematical complexity into operational insights. Those equipped with a platform that integrates these tools in a synergistic and intuitive yet rigorous manner are already a step beyond the line that separates mere reporting from real advisory.
The volatility cone and Value at Risk are not just calculation tools: they are lenses through which to observe uncertainty, languages to communicate risk, compasses to navigate the complexity of modern financial markets.
In a world where volatility is no longer the exception but the rule, the ability to measure, visualize, and communicate risk becomes the true discriminator between those who are subjugated by uncertainty and those who transform it into strategic opportunity.
Monica F. Zerbinati

Richiedi la prova gratuita a welcometeam@fidaonline.com


